From Excel Spreadsheets
to Machine Learning Models.
Kerala's most advanced Data Analytics program. Master Excel, SQL, Python, Power BI, Tableau, and GenAI — in one structured 24-week program designed to make you job-ready as a Data Analyst, BI Developer, or ML-ready Analyst.
- Duration: 24 Weeks (6 Months)
- ⏱ Effort: ~240–260 Total Hours
- Mode: 2 Hours/Day · 5 Days/Week

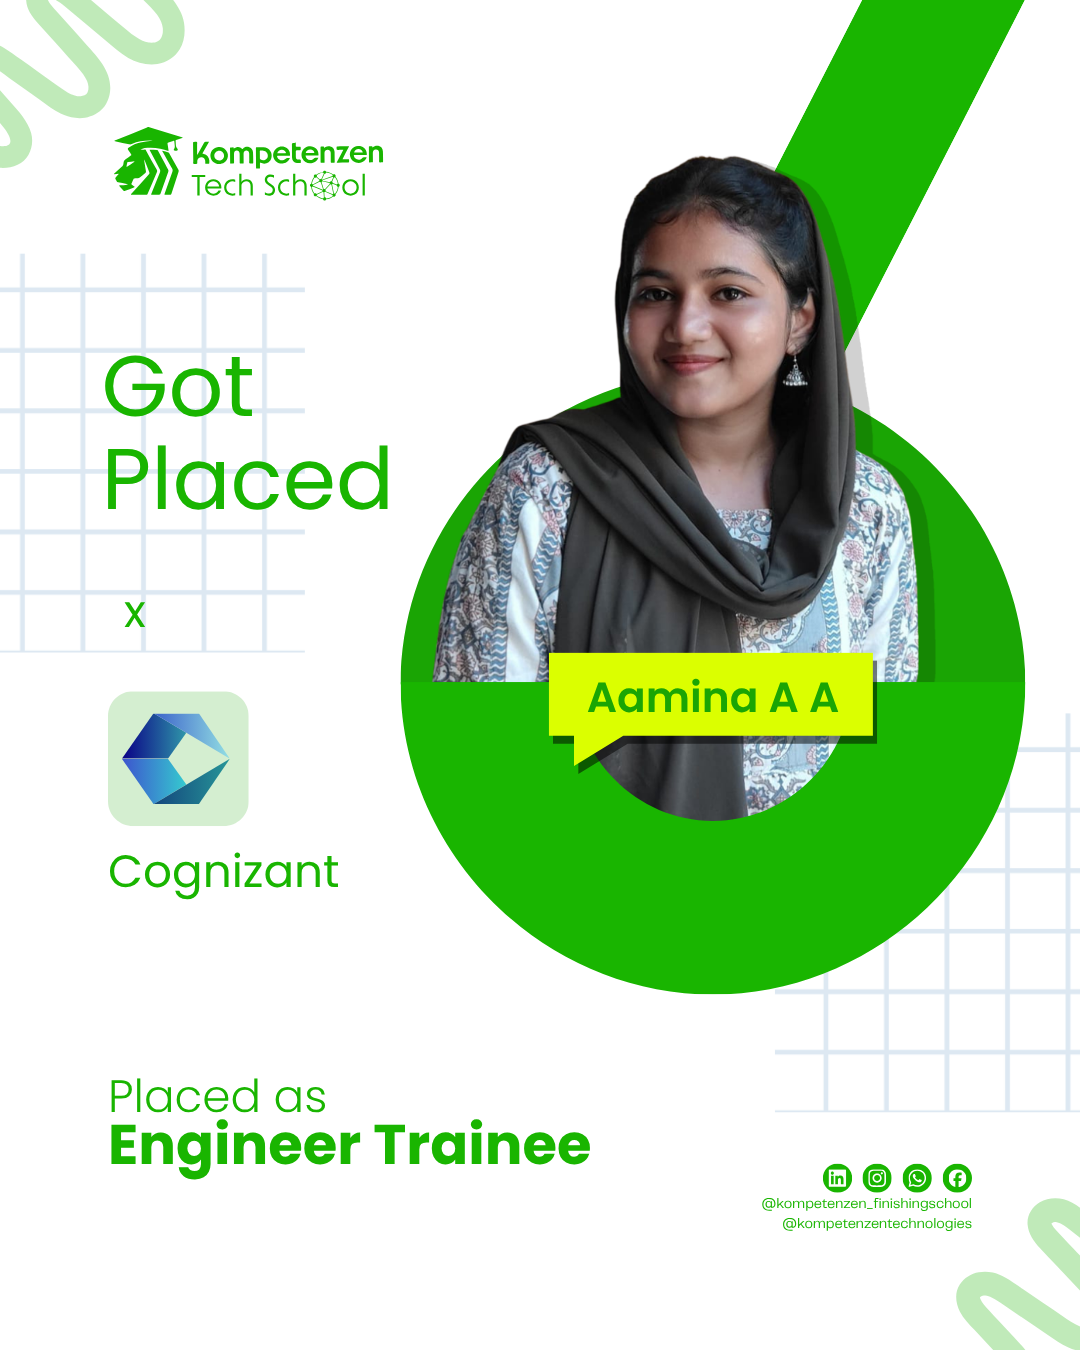
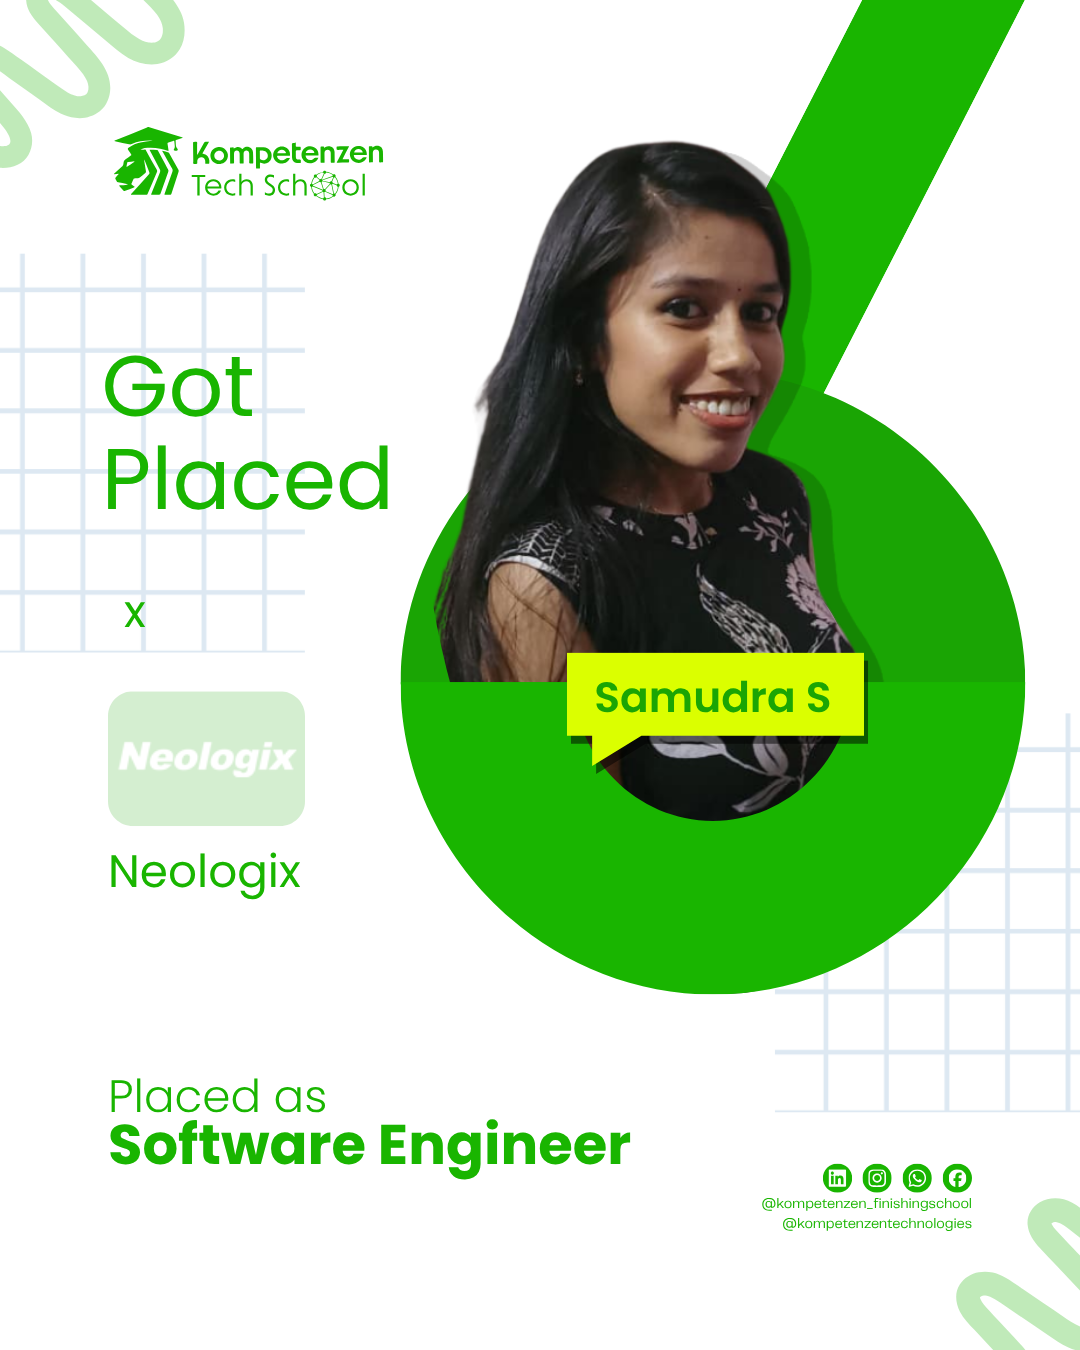
Recent Graduates Working At


.png)


Three Pillars. One Outcome:
Becoming a Job-Ready Analyst.
The Kompetenzen Data Analytics program is built on three pillars designed for maximum career impact:
DEPTH
Advanced mastery of Excel, Power BI & Tableau. Not surface-level. You will build production-grade dashboards that pass enterprise-level reviews.
BREADTH
Aligned with structured professional certification syllabi. Our curriculum maps to Microsoft Power BI, Google Data Analytics, and Tableau certification standards.
INNOVATION
Integration of GenAI for Analysts & Machine Learning. You won't just analyze data. You'll automate insight generation with AI and build your first ML models.
OUTCOME
Job-ready Data Analyst / BI Analyst with strong tool mastery, analytics expertise, visualization skills, and ML exposure.
Your Month-by-Month
Analyst's Ascent.
Tool Focus: Microsoft Excel
- Week 1–2: Core Concepts & Data Fundamentals (IF/IFS/SUMIF)
- Week 3: Advanced Lookup Patterns (VLOOKUP, XLOOKUP, INDEX MATCH)
- Week 4: Analytics & Automation (Pivot Tables, Power Query, Macros)
Tool Focus: SQL / MySQL
- Week 5–6: Relational Fundamentals (SELECT, JOINs, GROUP BY)
- Week 7: Advanced Techniques (Subqueries, CASE, Window Functions)
- Week 8: Optimization & Procedure (CTEs, Stored Procedures, Performance)
Tool Focus: Python
- Week 9: Essentials (Variables, Loops, Data Structures)
- Week 10: Workflow (Functions, File I/O, Error Handling)
- Week 11: The Data Stack (NumPy, Pandas DataFrames)
- Week 12: Pandas Analytics + Visualization (Groupby, Matplotlib, Seaborn)
Tool Focus: Power BI + Advanced Visualization
- Week 13: Visualization Principles & Data storytelling
- Week 14: Python Visualization Integration (Plotly)
- Week 15: Power BI Core (Power Query, Data Modeling, Star Schema)
- Week 16: Advanced Power BI (DAX, Time Intelligence, Row Level Security)
Tool Focus: Tableau + Statistics
- Week 17–18: Tableau Mastery (Dimensions, Measures, LOD Expressions, Story Points)
- Week 19: Statistics for Analysts (Distributions, Correlation, Regression, Testing)
- Week 20: Exploratory Data Analysis (EDA, Outliers, Feature Engineering)
Tool Focus: ML + GenAI + Big Data
- Week 21–22: Machine Learning Fundamentals (Supervised vs Unsupervised, Clustering, Model Evaluation)
- Week 23: GenAI for Analysts (Automated Insight Generation, Prompt Engineering for SQL/Python)
- Week 24: Big Data & Career Prep (Spark basics, Mock Interviews, Portfolio)
Graduate With 5–6 Industry-Grade
Projects in Your Portfolio.
Project 1: Excel MIS Dashboard
Interactive reporting with pivot tables, Power Query & conditional formatting.
Project 2: SQL Query Reports
Business analytics case study with complex queries, CTEs & window functions.
Project 3: Python Data Pipelines
Automated data pipelines using Pandas for real-world messy datasets.
Project 4: Interactive BI Dashboards
Executive-level Power BI & Tableau dashboards with DAX measures & RLS.
Project 5: ML Model + GenAI Analysis
Regression/classification model + AI-powered narrative generation.
Career Paths You Can Pursue.
Core Analytics
- • Data Analyst
- • Junior Data Analyst
- • Business Data Analyst
- • Analytics Executive
Business Intelligence
- • BI Analyst
- • Power BI Developer
- • Tableau Developer
- • Reporting Analyst
Specialized & Emerging
- • Marketing / HR Analytics
- • Sales Analytics Exec
- • GenAI Analytics Associate
- • Operations Analyst
Salary Range (India)
Entry Level
₹3L – ₹5.5L /yrMid Level
₹5.5L – ₹10L /yrFreelance BI
₹500 – ₹1500 /hrFrequently Asked Questions
Ready to Launch Your Data Career in 24 Weeks?
From zero analytics experience to job-ready Data Analyst in 6 months. Join 1,000+ professionals who transformed their careers at Kompetenzen.